


British American Investments Company Limited emerged the top gainer of the day with 9.70 percent at a price of 13.00 shillings per share followed by E.A Cables Ltd which posted 8.66 percent at a price of 6.90 shillings per share. Sameer Africa Ltd, Fahari Income – REIT posted and Uchumi Supermarkets Ltd posted 7.35, 4.76 and 3.92 percent respectively at a price of 3.65, 22.00 and 5.30 shillings per share respectively.
The table below outlines how things went down among the top gainers of the day:
| STOCK | DEMAND | SUPPLY | BID | PRICE | DEALS |
| BRIT | 2,666,200 | 3,494,800 | 10.70 | 13.00 | 74 |
| CABL | 46,900 | 57,900 | 6.00 | 6.90 | 7 |
| FIRE | 81,300 | 42,500 | 3.35 | 3.65 | 6 |
| FAHR-I | 23,700 | 69,000 | 20.00 | 22.00 | 3 |
| UCHM | 34,900 | 85,200 | 5.00 | 5.30 | 5 |


The image below shows how the top gainers fared in terms of percentages:

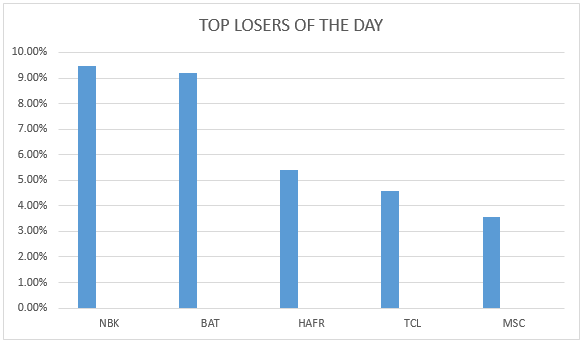
National Bank of Kenya seems to be in a series of woes this year especially after registering a loss of 1.2 billion shillings. The lender was the top loser of the day closing at 9.47 percent at a price of 11.00 shillings per share. British American Tobacco Kenya Limited was the second top loser with 9.19 percent at a price of 771.00 shillings per share. Home Africa Ltd, Trans-Century Ltd and Mumias Sugar Company Ltd each lost 5.41, 4.59 and 3.57 percent respectively at a price of 1.75, 5.20 and 1.35 shillings per share respectively.
The table below is a summary of how the top losers performed:
| STOCK | DEMAND | SUPPLY | BID | PRICE | DEALS |
| NBK | 50,300 | 73,000 | 10.95 | 11.00 | 28 |
| BAT | 5,100 | 6,300 | 771.00 | 771.00 | 2 |
| HAFR | 118,200 | 218,700 | 1.75 | 1.75 | 33 |
| TCL | 28,100 | 69,900 | 4.95 | 5.20 | 9 |
| MSC | 1,561,600 | 450,900 | 1.35 | 1.35 | 47 |
The image below shows how the top losers of the day shared the slots:
Safaricom Limited maintained its position as the top mover of the day presenting a volume of 18.10 million and a market capital of 673.10 billion. Other top movers are as shown in the table below:
| MOVER | VOLUME | MARKET CAPITAL |
| SCOM | 18.10 M | 673.10 B |
| EQTY | 7.00 M | 154.72 B |
| KCB | 2.98 M | 127.81 B |
| COOP | 797,900 | 100.23 B |
| KEGN | 754,400 | 17.48 B |
This is how things went down among the top movers of the day:
| MOVER | DEMAND | SUPPLY | BID | PRICE | DEALS |
| SCOM | 7,303,200 | 8,312,900 | 15.90 | 16.80 | 192 |
| EQTY | 3,193,500 | 3,749,400 | 39.50 | 41.00 | 96 |
| KCB | 2,592,000 | 1,723,100 | 41.50 | 42.25 | 127 |
| COOP | 597,500 | 1,219,600 | 20.00 | 20.50 | 68 |
| KEGN | 726,900 | 711,600 | 7.70 | 7.95 | 45 |
Article by Juma Fred.