


All four major indices closed higher, but turnover fell by 34%. The session’s most important signal was not simply that prices rose—it was that Kenyan investors absorbed heavy foreign selling and kept the market’s 2026 advance intact.
Market close: 16 July 2026 | Equity turnover: KES 398.7 million (USD 3.1 million) | Market capitalisation: USD 30.1 billion.
THE MARKET IN ONE SENTENCE A positive close supported by strong local participation, resilient blue-chip demand and a powerful year-to-date trend—but weakened by lower turnover and a sizeable foreign exit. |

Key numbers readers should understand
| Indicator | Today | Indicator | Today |
| NSE 20 | +0.38% | NSE 25 | +0.27% |
| N10 | +0.24% | NASI | +0.16% |
| Turnover | USD 3.1m | Daily change | -34.0% |
| Local activity | 84.9% | Foreign net flow | -USD 852.8k |
| Top gainer | EAPCC +6.5% | Top loser | Home Afrika -5.6% |
| Market cap. | USD 30.1bn | NASI YTD | +24.28% |
The Nairobi Securities Exchange ended the session in positive territory, but the headline “market up” only tells half the story. The more revealing development was the clash between two forces: local investors increased their dominance of trading while foreign investors sold heavily. Local demand won the day, allowing every major index to close higher even as total trading activity contracted sharply.
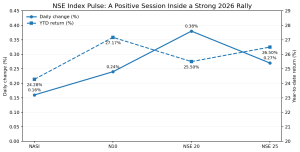
The NSE 20 led the advance with a 0.38% gain, followed by the NSE 25 at 0.27%, the N10 at 0.24% and the NASI at 0.16%. The breadth of those gains matters. It means the improvement was not isolated to one narrow segment of the market; the upward move was visible across the broad market, the largest companies and the traditional blue-chip index.

A green close—but not a high-conviction stampede
A rising market is normally more convincing when it is accompanied by increasing turnover because that suggests more investors are committing more money to the move. Today, the opposite happened: equity turnover fell by 34.0% to USD 3.1 million, or KES 398.7 million. Based on the reported decline, the previous session’s turnover was approximately USD 4.70 million.
This does not cancel the bullish close, but it changes how it should be interpreted. The market moved higher with less money changing hands. That can mean sellers were reluctant to offer shares at lower prices, but it can also mean the rally lacked the deep participation needed to confirm a powerful breakout. Investors should therefore celebrate the direction while remaining alert to the quality of the move.
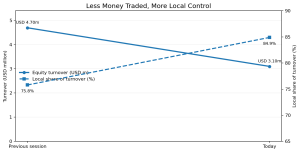

Figure 2: Turnover declined, but local investors’ share of activity rose from 75.8% to 84.9%. Previous turnover is inferred from the reported 34% fall.
Local investors are increasingly setting the market’s direction
Local investors accounted for 84.9% of turnover, up from 75.8% in the previous session. That nine-percentage-point jump is one of the day’s strongest signals. It shows that the market’s immediate direction was being determined mainly by domestic institutions and individual investors rather than offshore funds.
This matters because foreign flows have historically had an outsized influence on the NSE, especially in the most liquid counters. When local capital is strong enough to absorb foreign selling without allowing the indices to collapse, it points to deeper domestic confidence and improved market resilience. It also reduces the risk that every foreign exit automatically becomes a market-wide sell-off.
However, local dominance should not be confused with unlimited buying power. The sharp fall in turnover shows that domestic investors controlled a smaller pool of traded money. The next test is whether local participation remains high when turnover expands and whether that demand can continue supporting prices if foreign selling persists.
Equity Group carried the market’s heaviest traffic—and absorbed the heaviest foreign selling
Equity Group was the day’s most active counter, contributing 19.3% of total turnover. Shares worth KES 77.0 million changed hands, and the price still strengthened by 0.3% to KES 87.00. That price resilience is particularly important because foreign investors accounted for 81.3% of selling in the counter. In simple terms, the market found enough buyers to absorb a large foreign exit without pushing Equity’s price lower.
The other major counters produced a mixed picture. KCB Group gained 0.3% to KES 80.25, while Stanbic Holdings was unchanged at KES 291.00. Co-op Bank declined 0.6% to KES 34.75, Family Bank lost 0.4% to KES 24.85, and Safaricom eased 0.1% to KES 35.40. The divergence shows that investors were not buying the market blindly; they were selecting individual counters and pricing company-specific demand, liquidity, and foreign flow pressure.
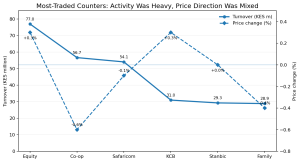

Figure 3: Equity Group led turnover, while price changes among the most-traded counters remained modest and mixed.
What happened in the six most-traded counters
| Counter | Price (KES) | Change | Turnover (KES m) | Foreign sales |
| Equity | 87.00 | +0.3% | 77.0 | 81.3% |
| Co-op | 34.75 | -0.6% | 56.7 | 0.0% |
| Safaricom | 35.40 | -0.1% | 54.1 | 28.8% |
| KCB | 80.25 | +0.3% | 31.0 | 13.0% |
| Stanbic | 291.00 | +0.0% | 29.3 | 94.4% |
| Family | 24.85 | -0.4% | 28.9 | 0.0% |
The strongest and weakest shares reveal a market with appetite—and risk
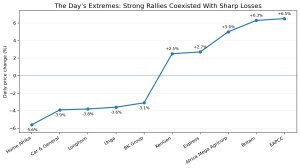
EAPCC surged 6.5% to a record KES 106.50, finishing as the day’s top gainer. Britam followed with a 6.3% rise to KES 16.75, while Africa Mega Agricorp gained 5.0%, Express advanced 2.7%, and KenGen added 2.5%. These moves show that risk appetite extended beyond the largest banks and telecommunications counters into smaller and more volatile names.
But the losses were equally instructive. Home Afrika fell 5.6% to KES 1.19, Car & General declined 3.9%, Longhorn dropped 3.8%, Unga lost 3.6%, and BK Group retreated 3.1%. The wide gap between the best and worst performers means the market was bullish at the index level but highly selective underneath. A green index does not mean every investor made money.

Foreign investors voted with their feet—but the market refused to fall
Foreign investors remained bearish, recording a reported net outflow of USD 852,800. Foreign purchases amounted to only USD 50,300, while foreign sales reached USD 882,100. I&M Bank attracted the strongest foreign buying, while Equity Group carried the heaviest foreign selling pressure.
Ordinarily, that imbalance would be expected to weigh on the market’s largest and most liquid shares. Instead, the broad indices advanced. This is the clearest evidence that local buying was not merely present—it was effective. Domestic investors stepped into the market at the point where foreign investors were reducing exposure, preventing the selling from becoming a broad price collapse.
The foreign-flow numbers supplied for the session contain a small arithmetic difference between gross purchases, gross sales and the separately reported net outflow, likely reflecting rounding, exchange-rate treatment or classification timing. The directional conclusion is nevertheless unambiguous: foreign investors were substantial net sellers.
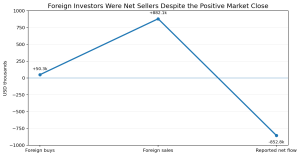

Figure 5: Foreign selling far exceeded buying, producing a sizeable reported net outflow.
Today’s modest gains sit on top of a powerful year-to-date advance
The day’s percentage gains were small, but the broader 2026 trend remains strong. The NASI is up 24.28% year to date, the NSE 20 has gained 25.50%, the NSE 25 is higher by 26.50%, and the N10 leads with a 27.17% return. These are not marginal movements; they point to a significant re-rating of Kenyan equities during the year.
A rally of this scale can attract new investors, but it also raises the importance of valuation discipline. Shares that have already risen sharply may continue advancing if earnings, dividends and economic conditions justify the move. They can also become vulnerable to profit-taking when turnover weakens, or foreign investors accelerate exits. The right reading is neither blind optimism nor automatic fear: it is disciplined attention to liquidity, earnings quality and the sustainability of demand.
What investors should watch next
| Turnover | A stronger follow-through requires trading value to recover from today’s USD 3.1 million. Rising prices with rising turnover would provide a more convincing bullish signal. |
| Foreign flows | Continued offshore selling could test whether local investors have enough capital to keep absorbing supply, particularly in Equity Group, Safaricom and other liquid blue chips. |
| Banking counters | Banks dominated activity but moved in different directions. Their next moves will help determine whether the rally remains broad or becomes concentrated in a few names. |
| Market extremes | EAPCC and Britam posted sharp gains while Home Afrika and other counters fell heavily. Investors should distinguish sustainable repricing from short-term momentum. |
The bottom line
Today’s session was a victory for market resilience, not a declaration that all risks have disappeared. The NSE rose across all major indices, Equity Group absorbed intense foreign selling without losing ground, and local investors increased their control of market activity. At the same time, turnover dropped substantially, foreign capital moved out, and individual counters recorded sharp losses.
The most accurate conclusion is therefore balanced but encouraging: Kenya’s equity rally remains alive, increasingly supported by domestic capital and backed by strong year-to-date returns. The next phase will depend on whether higher prices can attract deeper turnover, whether foreign selling moderates, and whether corporate earnings can justify the market’s rapid revaluation.
For now, the market has sent a powerful message: foreign investors may have been selling, but Kenyan investors were not willing to surrender the rally.
Read Also: NSE Slips as Safaricom Hits a Four-Year High and Locals Take Control