
Mansa-X Under the Microscope: Seven Hard Questions, the Facts Behind Them and the Disclosures Investors Still Deserve

Mansa‑X has emerged as one of the most significant investment products in East Africa, both in terms of scale and visibility. By mid‑2026, assets under management across its Kenya‑shilling and US‑dollar funds had reached KES 184.32 billion, a level that naturally attracts scrutiny. Yet scrutiny, when met with transparency and evidence, can strengthen investor confidence rather than weaken it. The fund’s record, mandate, and governance framework demonstrate that Mansa‑X is not only delivering returns but also operating within a disciplined and regulated structure designed to safeguard investors.
Performance is the most visible measure of any investment product, and Mansa‑X’s record is both consistent and verifiable. The Kenya‑shilling fund has delivered an average annualised net return of 18.37% from January 2019 to June 2026. The US‑dollar fund, launched in November 2022, has achieved 12.51% over the same period. Interim results for the first half of 2026 showed net returns of 10.97% for the KES fund and 6.54% for the USD fund. If sustained, these would equate to annualised rates of 23.15% and 13.51% respectively.
Historical data reinforces this picture. Between 2019 and 2025, the KES fund reported annual net returns ranging from 15.45% to 20.74%. The USD fund, though younger, reported 12.10% in 2023, 12.50% in 2024, and 13.37% in 2025. A KES 1 million investment made in January 2019 was valued at KES 3.59 million by March 2026 after fees, while a USD 10,000 investment in November 2022 had grown to USD 14,949. These figures, supported by audited statements, demonstrate a multi‑year record that is both testable and reconcilable. They confirm that performance is not a one‑off windfall but the result of a repeatable strategy.

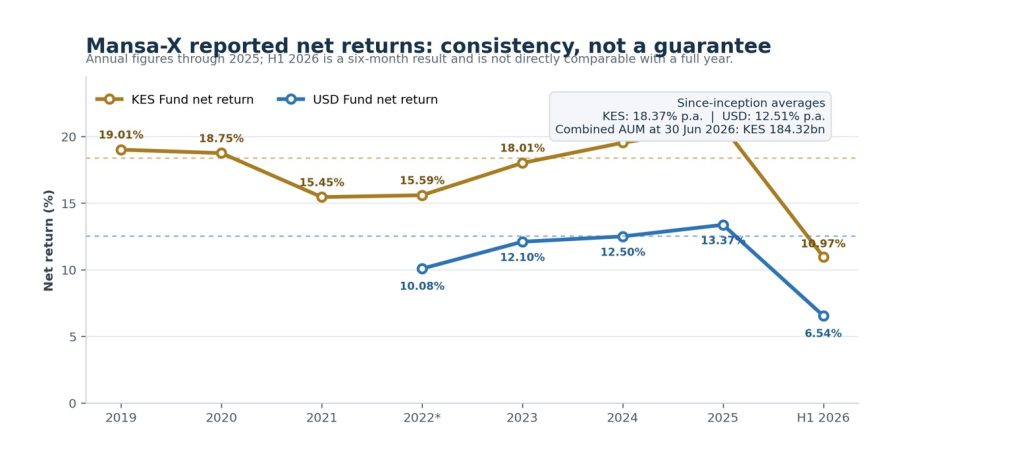
Figure 1. Reported annual net returns for the KES and USD funds. H1 2026 is shown as an actual six-month return, not an annual return. The dotted lines mark the manager-reported since-inception annualised averages to 30 June 2026.
Mansa‑X is not a conventional money‑market fund. It is a special collective investment scheme with a global, multi‑asset, long‑short mandate. Its portfolio may include currencies, listed equities, stock indices, sovereign fixed income, commodities, precious metals, derivatives, and cash across major international markets. This breadth of mandate is the source of both its return potential and its complexity.
The fee structure reflects this sophistication: a 5% annual financial‑services charge, prorated daily, and a 10% performance fee on returns above a 25% hurdle for the KES fund and 15% for the USD fund. There are no initial or redemption fees, but a six‑month lock‑in applies. These terms are transparent and aligned with the nature of the strategy. They also highlight why Mansa‑X should not be compared directly with money‑market funds, where strategies, risks, fees, and liquidity terms are materially different.
The umbrella structure of the fund has occasionally prompted questions about cross‑liability between sub‑funds. In practice, each sub‑fund maintains independent mandates, accounting records, portfolios, unitholders, and net asset values. Management and reporting are carried out separately, and no sub‑fund’s assets have ever been used to settle another’s liabilities. While the trust deed does contain a cross‑liability provision, the operational reality is one of separation and discipline. Investors can therefore be confident that the structure is regulated, overseen by a trustee and custodian, and subject to external audit.
Income reporting has shown that more than 80% of the two funds’ income is classified as offshore trading gains. This is consistent with the fund’s global mandate and reflects realised and unrealised positions across currencies, equity indices, commodities, sovereign fixed income, and equities. While the distinction between realised and unrealised gains is important, the broader point is that income is generated within approved investment limits and subject to board oversight.
Valuation practices follow internationally accepted standards. Instruments with observable market prices are marked to quoted values, while those without active quotations are valued using recognised methods overseen by management, trustee, and auditor. Daily unit prices are pub