Skip to content
Investment

How Cheaper Funding, A 20% Surge In Loans And A 50% Dividend Lift Are Rewriting NCBA Bank’s Earnings Story As The Nedbank Deal Approaches Its Decisive Phase
BY Steve Biko Wafula · August 7, 2026 10:08 am

There are bank results that impress because the profit number is large, and there are bank results that matter because the machinery underneath the profit has changed. NCBA Group’s first-half 2026 numbers belong in the second category. The headline is clean enough: profit after tax rose 12.2% year on year to KES 12.39 billion, and earnings per share advanced to KES 7.52. Yet the more consequential story is not the KES 1.34 billion added to the bottom line. It is the way the bank generated that growth – through a materially cheaper funding base, wider interest margins, faster loan growth, stronger operating leverage, and a deliberately larger credit-loss buffer at a moment when the institution is also approaching a potentially transformative change in ownership.

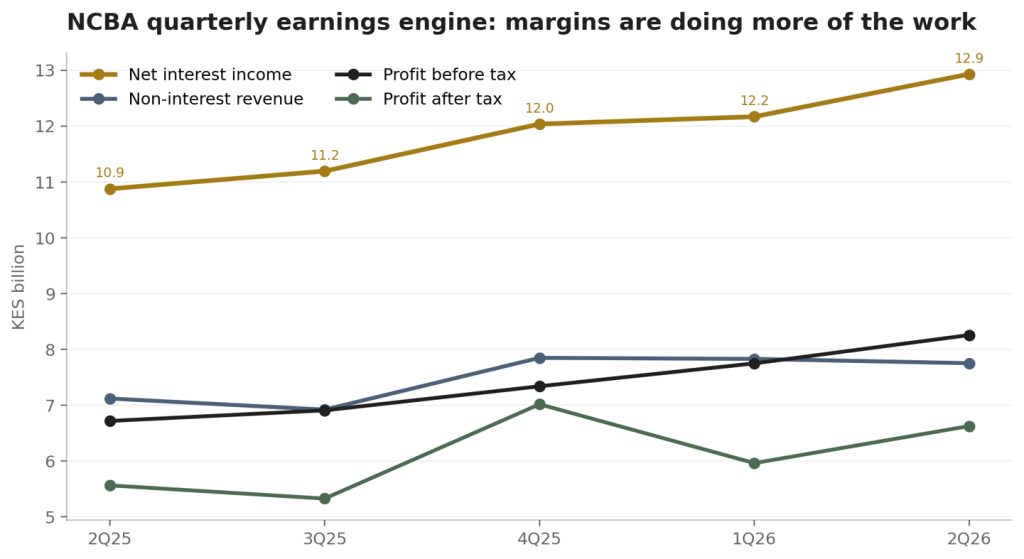
At first glance, a 12.2% rise in earnings can look merely solid rather than spectacular. But that interpretation misses the force of the income statement. Interest income rose 7.6% to KES 36.54 billion while interest expense fell 12.8% to KES 11.44 billion. That combination lifted net interest income by 20.4% to KES 25.10 billion. In other words, the bank did not need explosive asset yields to grow its core banking spread; it benefited from the repricing of liabilities and from a much more favourable relationship between the yield earned on assets and the cost paid for funding. Standard Investment Bank estimates NCBA’s net interest margin at about 8.4% for the half, compared with about 7.3% a year earlier.

Read Also: NCBA Sponsors 10 Creators for Creative Economy 101 as New Programme Targets Africa’s Creative Entrepreneurs

Figure 1. Quarterly income and earnings trajectory, KES bn. Source: NCBA company filing as presented by Standard Investment Bank; Soko Directory Research calculations.

The funding story is especially important because it explains why a relatively modest 7.6% rise in interest income translated into a much larger 20.4% rise in net interest income. Customer deposits expanded 11.0% to KES 551.41 billion, but the estimated weighted average rate paid on those deposits fell to about 4.1% from 4.8% in 1H25. Expenses on customer deposits consequently declined 11.3% to KES 10.9 billion. For a bank, that is powerful operating chemistry: the deposit franchise became larger while the average price of that funding moved lower. It gave NCBA room to grow lending even as lending rates themselves softened.

That is visible on the asset side. Net loans and advances climbed 20.1% year on year to KES 345.88 billion, a much faster pace than deposit growth and one of the clearest signals in the results that private-sector credit demand is beginning to recover. The estimated weighted average lending rate eased to about 12.9% from 13.4% a year earlier, consistent with the transition toward Central Bank Rate-linked pricing and the effect of rate cuts during the period. Loan interest income therefore grew only about 2.0%, but volume compensated for price. The balance sheet was doing more work even though each shilling of lending was, on average, earning a slightly lower rate.

NCBA did not depend on loans alone. Investment securities increased 19.8% to KES 259.29 billion and interest income from government securities rose 12.3% to KES 14.2 billion. Income from deposits and placements with banking institutions and other interest income rose 45.7% to roughly KES 2.0 billion. The result is a more diversified interest engine: loans are expanding, securities are contributing more income, and funding costs have fallen sharply enough to widen the spread between what the bank earns and what it pays.
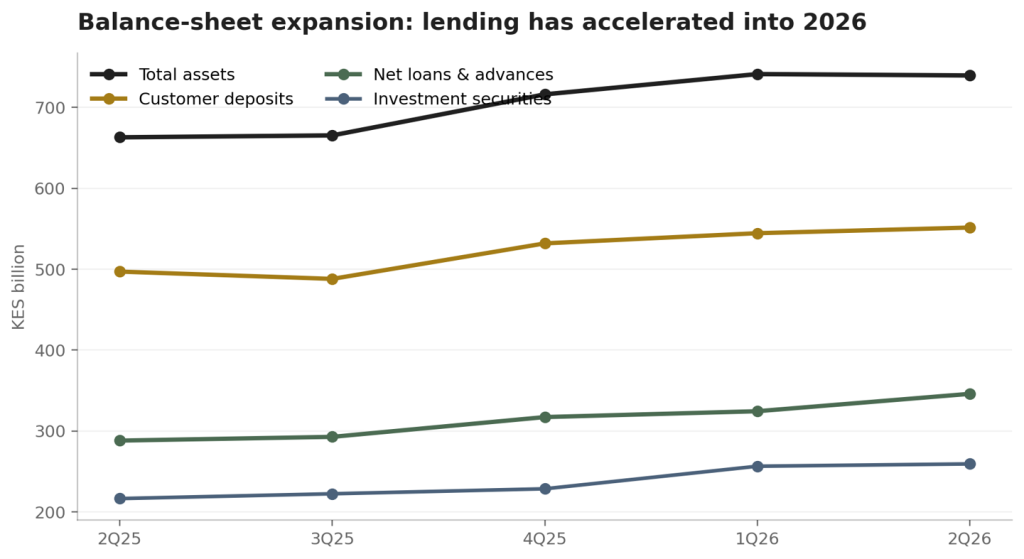
Figure 2. Balance-sheet trajectory from 2Q25 to 2Q26. Source: NCBA company filing as presented by Standard Investment Bank.

The non-interest side of the business also grew, though not as quickly as the interest engine. Fees, foreign-exchange income and other income together reached about KES 15.58 billion, up 7.6% year on year. Fee and commission income rose 9.1% to KES 10.08 billion, including a 9.5% rise in fees and commissions on loans and advances to KES 6.8 billion. Foreign-exchange trading income increased 8.4% to KES 2.64 billion, while other income was almost flat at KES 2.87 billion. Because net interest income grew much faster, non-interest revenue’s share of total operating income eased to 38.3% from 41.0% a year earlier. That is not a collapse in diversification; it is principally a reflection of a much stronger interest-income contribution.

The scale of NCBA’s digital franchise remains difficult to ignore. Digital loan disbursements increased 26.9% to approximately KES 819 billion in the first half, while mobile banking accounted for 94% of transaction volumes. Those figures help explain why fees can keep growing without a comparable expansion in a traditional branch footprint. The bank’s digital platforms are not a side business attached to a conventional lender; they are part of the operating architecture through which NCBA reaches customers, originates credit and processes activity at mass scale.

That digital scale is also why technology expenditure deserves to be read as more than a cost line. Operating expenses excluding loan-loss provisions rose 5.1% to KES 19.51 billion. Staff and directors’ costs increased 10.3% to KES 8.69 billion, while the group continued investing in technology infrastructure, artificial-intelligence adoption, cyber resilience and core systems. Yet total operating income grew 15.1% to KES 40.68 billion. The result was positive operating leverage: income expanded almost three times as fast as operating costs. On Soko Directory Research calculations using the SIB financial table, the cost-to-income ratio improved to about 47.9% from 52.5% in 1H25.

That efficiency gain is one of the strongest quality signals in the half-year numbers. Profit before impairments – the earnings generated before the bank charges expected credit losses – rose 26.2% to KES 21.18 billion. This is also where an important distinction matters: KES 16.01 billion is profit before tax, not profit before impairments. The underlying operating engine produced KES 21.18 billion before provisions, up from KES 16.78 billion in the comparable period. That gives the bank more capacity to absorb credit costs without surrendering earnings growth.

Read Also: NCBA Launches East Africa’s First AI Property Ecosystem as Duka Platform Nears 7 Million Users, KES 4 Billion Transactions

Figure 3. Income growth has outpaced operating costs, creating room for a larger impairment charge. Source: NCBA company filing as presented by Standard Investment Bank.

And absorb credit costs it did. Loan-loss provisions rose 60.3% to KES 5.17 billion. The increase restrained the translation of operating profit into net profit, and it pushed the estimated cost of risk to roughly 3.3% from about 2.2% in 1H25 on SIB’s methodology. A 60% rise in provisions deserves attention; it is the clearest cautionary line in the results. But it should be read together with the growth in the loan book and the bank’s asset-quality indicators rather than in isolation.

The gross non-performing-loan ratio stood at 10.5%, below the roughly 15.3% Kenyan industry average cited in the SIB note. At the same time, gross NPL stock rose 5.7% to KES 40.3 billion. Both statements can be true because the denominator – the loan book – grew much faster. The ratio therefore improved partly because performing loans expanded, not because the absolute stock of problem loans disappeared. This is why the higher provisioning is rationally conservative: NCBA is growing credit quickly and is simultaneously increasing the cushion available to absorb deterioration if macroeconomic conditions or borrower performance weaken.

Figure 4. Return, margin and cost-of-risk indicators. 1Q26/2Q26 are quarterly SIB estimates; the 1H26 NIM cited in the article is approximately 8.4%.

After provisions, profit before tax rose 18.1% to KES 16.01 billion and profit after tax rose 12.2% to KES 12.39 billion. The second quarter itself finished strongly, with quarterly profit after tax at KES 6.63 billion, 19.1% above 2Q25 and 11.1% higher than 1Q26. EPS for the half reached KES 7.52 from KES 6.71. The Board’s proposed interim dividend of KES 3.75 per share is 50% higher than the KES 2.50 paid for the comparable period, implying a payout of about 49.9% of first-half earnings per share. The SIB note indicates a book-closure date of 28 August 2026.

Figure 5. The income mix has shifted toward interest income while efficiency has improved. Source: Company financials and Standard Investment Bank estimates.

The Kenyan bank remains the centre of gravity. NCBA Kenya reported net earnings of KES 11.6 billion, up 30.3% year on year, with net interest income of KES 22.7 billion, up 21.9%, and non-funded income of KES 10.8 billion, up 11.0%. But the wider group is becoming more strategically meaningful. Management figures cited by SIB show the banking operations in Uganda, Tanzania and Rwanda generating a combined KES 1.6 billion in profit before tax, supported by 11% income growth, 25% loan growth and recoveries. The non-banking businesses – including investment banking, insurance, leasing and bancassurance – collectively produced KES 1.1 billion in profit before tax, up 40% year on year.

That diversification matters because NCBA is entering a new strategic phase at precisely the moment its domestic balance sheet is accelerating. Nedbank’s offer is structured to acquire approximately 66% of NCBA’s issued ordinary shares. Nedbank’s official transaction materials state that, on successful completion, NCBA would become a Nedbank subsidiary while retaining its local leadership, brand identity, independent governance structures and Nairobi Securities Exchange listing, with the remaining 34% held by public investors. The offer closed for acceptances on 10 July 2026 and remains subject to the fulfilment or waiver of outstanding conditions, including regulatory approvals.

The SIB research note describes the tender as having attracted acceptances equivalent to about 121% of the shares Nedbank sought to acquire. That level of demand is consistent with an oversubscribed offer and underscores the significance shareholders attached to the transaction. It does not, however, mean the acquisition is already complete. Until the offer becomes unconditional and the required approvals are satisfied, the correct description is a proposed change of control rather than a completed one.

Strategically, the attraction is clear. NCBA brings Nedbank a substantial East African platform, a mass digital-lending franchise and an established regional network. Nedbank brings a larger cross-border balance sheet, corporate and investment-banking capability, global-market access and infrastructure that could deepen NCBA’s institutional offering. Nedbank has explicitly described NCBA as a cornerstone vehicle for its East African expansion. For NCBA shareholders, the key question is therefore no longer only how well the bank can compound earnings independently, but how much value a larger continental parent can add without weakening the local franchise that made NCBA attractive in the first place.

“The central story is not simply higher profit. It is stronger funding economics, faster lending, better operating leverage and a thicker credit buffer – all arriving just as NCBA approaches a potential change of control.”


Valuation makes that question immediate. The 6 August SIB note used a market price of KES 90.50 and placed NCBA at about 1.2 times tangible book value and roughly 6.3-6.4 times trailing earnings, versus banking-sector comparisons of around 1.3 times tangible book and 6.8 times trailing earnings. SIB also cited a dividend yield of 7.9% and a five-year average payout ratio of about 44.1%. Its fair-value estimate is KES 91.43 and its recommendation remains HOLD. At the reference price, the fair-value gap is small, so the investment case is less about a dramatic near-term valuation discount and more about dividends, earnings resilience, integration execution and the strategic optionality that could emerge under Nedbank ownership.

The beauty of these results is therefore not that every line is perfect. It is that the tensions inside the numbers are unusually revealing. Margins are stronger, but lending yields are lower. Loans are growing rapidly, but provisions are also rising rapidly. Non-interest income is still expanding, but its share of total income is shrinking because the interest engine is growing faster. Costs are higher, but efficiency is better because revenue growth is stronger. Asset quality looks healthier in ratio terms, but the absolute stock of NPLs is still rising. And the bank is producing this operating momentum while standing on the threshold of a transaction that could redraw its strategic map.

For investors and market watchers, that is the central conclusion: NCBA’s 1H26 story is not simply a 12.2% profit increase. It is a story of a bank whose funding economics have improved, whose balance sheet has regained lending momentum, whose digital machine is processing extraordinary volumes, whose operating leverage has strengthened and whose management is choosing to build a thicker credit buffer rather than maximise short-term reported profit. The next phase will test whether that discipline survives faster growth and whether the Nedbank transaction converts strategic promise into durable shareholder value. For now, the numbers suggest an institution entering that transition from a position of strength – but with enough credit-risk and execution complexity to justify a measured, rather than euphoric, reading of the result.

Read Also: NCBA H1 Profit Rises 12.2% to KES 12.4 Billion as Digital Lending, Deposits and Dividend Surge

Steve Biko is the CEO OF Soko Directory and the founder of Hidalgo Group of Companies. Steve is currently developing his career in law, finance, entrepreneurship and digital consultancy; and has been implementing consultancy assignments for client organizations comprising of trainings besides capacity building in entrepreneurial matters.He can be reached on: +254 20 510 1124 or Email: info@sokodirectory.com

Trending Stories
Related Articles
Explore Soko Directory
Soko Directory Archives