
Kenya Markets Hold Steady as Debt and Oil Costs Squeeze the Economy

Kenya’s financial markets can look calm while the economy beneath them remains under pressure. Banks are lending more to one another, the shilling has held broadly steady against the dollar, and government securities continue to attract substantial demand. Yet the cost of servicing debt and the threat of expensive energy leave businesses and households with little room to relax.
The September figures assembled by SIB Research explain that disconnect. Cash is circulating within the banking system, but public finances remain heavily dependent on borrowing. International interest rates and oil supply risks could make that dependence more expensive. For a trader waiting for customers, a manufacturer pricing the next production run or a family managing transport costs, this is where the market story becomes personal.
More money is moving between banks
SIB reports that the Kenya Shilling Overnight Interbank Average, or KESONIA, averaged 8.75%. Average interbank lending volumes rose from KES 9.60 billion to KES 11.40 billion, while the reported deal count increased from 16 to 23. Those changes amount to 18.8% and 43.8%, respectively, based on the displayed figures.

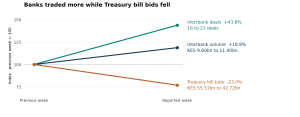
Figure 1. Relative weekly changes from SIB Research. Each series starts at 100; endpoint labels show the actual amounts. Lines connect two reported observations and do not show daily trading.
Interbank lending helps banks meet short-term cash needs and settle payments. Greater activity alongside a stable overnight rate is consistent with orderly funding conditions. It does not establish that businesses can obtain cheaper loans: customer lending still depends on credit risk, bank margins and the borrower’s ability to repay.
Treasury bill demand cools as investors favour short commitments
Investors submitted KES 42.72 billion in Treasury bill bids, down from KES 55.51 billion the previous week. That is a KES 12.79 billion decline, or 23.0%. Demand softened, although it remained substantial. The government accepted KES 42.42 billion, almost all the money offered by bidders.
Two percentages tell different stories here. Accepted bids divided by submitted bids produce an acceptance rate of 99.3%. SIB’s reported auction performance of about 153% measures demand against the amount offered for sale. A higher acceptance rate can coexist with fewer bids; it should not be presented as stronger investor appetite.
The 91-day bill attracted approximately KES 23 billion against KES 8 billion on offer, close to three times the available amount. SIB reports a 291% performance rate. Dividing the rounded KES 23 billion by KES 8 billion gives 287.5%, so the exact percentage requires the unrounded auction totals. The economically meaningful point survives the rounding: investors showed a strong preference for the shortest bill.
A three-month commitment can suit an investor who expects to need cash soon or wants an early opportunity to reinvest at a different rate. Demand alone cannot tell us which motive dominated. Nor does it prove that investors rejected longer securities, because those securities attracted substantial bids too.
Strong bond bids do not mean the Treasury took every shilling
The reopened FXD1/2019/020 and FXD1/2026/030 bonds, carrying reported coupons of 12.9% and 12.5%, drew approximately KES 81 billion against a KES 60 billion offer. The government accepted around KES 50 billion. On these rounded figures, demand covered 135% of the offer, but accepted bids covered only 83.3% of the amount sought.
| Auction measure | Calculation from rounded figures | Result |
| Demand relative to offer | KES 81bn ÷ KES 60bn | 135.0% |
| Accepted share of bids | KES 50bn ÷ KES 81bn | 61.7% |
| Accepted amount relative to offer | KES 50bn ÷ KES 60bn | 83.3% |
SIB reports approximately 136% demand coverage and 61% acceptance; small differences arise when its rounded amounts are used for calculation. Demand at 136% of the offer means bids exceeded the offer by approximately 36%. It does not mean an additional 136% was raised.
The government’s willingness to leave some bids unaccepted may reflect the yields investors demanded or other auction considerations. The totals alone do not establish the reason. They do show why an oversubscribed auction and a fully funded borrowing target are different outcomes.
The coupon also needs careful interpretation. It is the stated annual interest payment as a percentage of a bond’s face value. An investor’s yield depends on the price paid and remaining cash flows. A 12.9% coupon therefore cannot be treated as a guaranteed 12.9% annual investment return at every purchase price.
September brings a smaller repayment bill
Domestic debt maturities fall from KES 294 billion in August to KES 238 billion in September, according to SIB Research. The KES 56 billion reduction, equivalent to 19.0%, eases the immediate refinancing requirement. It still leaves a substantial amount falling due.
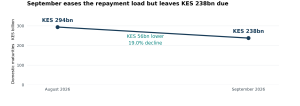
Figure 2. Monthly domestic debt maturities reported by SIB Research. The line compares two monthly totals; it does not represent the path of repayments within either month.
Maturing securities return money to investors, some of which may be reinvested in fresh government paper. The Treasury must obtain the cash to meet those obligations through revenue, existing balances or financing. A smaller monthly maturity total helps, but it does not by itself reduce the outstanding debt stock or remove the need for new borrowing.
Debt service leaves little breathing room in public finances
In the fiscal outturn reported as at 31 August 2026, the second month of FY2026/27, tax collections stood at KES 178.22 billion, up 13.35% year on year. Non-tax revenue contributed KES 5.89 billion. Domestic borrowing was KES 325.59 billion, alongside KES 1.23 billion in other domestic financing and KES 3.94 billion in external loans and grants.
Against those inflows, SIB records KES 267.09 billion in public debt service, KES 141.19 billion in recurrent spending, KES 14.98 billion in development expenditure and KES 34.24 billion in the counties’ equitable share. The contrast is stark: reported debt service was nearly 18 times development spending.
That ratio compares cash outlays. Debt service can include repayment of principal as well as interest, so it must not be described as an interest bill or used to calculate a budget deficit from this summary. The early fiscal-year figures also cannot establish how the full year will end.
Even with those distinctions, the pressure is clear. Borrowing supports today’s payments while committing future resources. Slow development spending can delay the infrastructure that businesses need to lower costs and expand production. The central question is whether public financing will create enough productive capacity to make tomorrow’s obligations easier to meet.
A steady dollar rate does not protect every importer
Currency stability depends on the currency in which a business pays its bills. In the earlier weekly snapshot accompanying the 3–10 September commodity figures, SIB reported the shilling broadly unchanged against the dollar, stronger against the yen and regional currencies, and weaker against sterling and the euro.
| Currency counterpart | Earlier reported weekly change in KES | Meaning |
| Japanese yen | +3.3% | Shilling strengthened |
| US dollar | 0.0% | Broadly unchanged |
| British pound | −0.6% | Shilling weakened |
| Euro | −0.5% | Shilling weakened |
| Ugandan shilling | +2.8% | Shilling strengthened |
| Tanzanian shilling | +0.2% | Shilling strengthened |
These are the earlier figures, not a single reading for every week in September. SIB’s 21 September report subsequently shows gains of 0.1% against the dollar and 1.6% against the Ugandan shilling, alongside losses of 0.2% against sterling, 0.4% against both the euro and yen, and 0.1% against the Tanzanian shilling. The Dollar Index also moved from an earlier 0.13% weekly decline to a later 1.14% increase.
For a Kenyan importer settling a sterling or euro invoice, a weaker shilling raises the local-currency cost even when USD/KES looks stable. A stronger shilling can reduce the cost of buying foreign currency, but exporters receiving that currency may obtain fewer shillings when they convert their receipts. Exposure depends on actual invoices and payment dates.
Higher global rates make financing more demanding
The Federal Reserve raised its target range by 25 basis points to 3.75%–4.00% on 16 September. The Bank of Japan announced an overnight call-rate target of around 1.25% on 18 September, effective 24 September. These decisions are confirmed in the central banks’ official releases. One basis point is one-hundredth of a percentage point.
Higher returns on major-country bonds can increase competition for international capital. Investors assessing Kenyan debt consider those alternatives alongside Kenya’s credit risk, maturity profile and market liquidity. Borrowing costs can therefore face upward pressure even when local overnight funding remains orderly.
Existing fixed-coupon bonds generally lose market value when the yield investors require rises. That matters to someone who may sell before maturity. Higher market yields also affect the price of new borrowing; they do not automatically rewrite the coupons on debt already issued.
The SIB commentary describes pressure on sovereign yields, but its narrative and separate Eurobond section give conflicting directions for Kenya’s weekly move. No precise Kenyan Eurobond change is used here. Likewise, higher yields alone do not establish a steeper yield curve; that requires comparing movements across maturities.
Oil delivers a warning that a stable shilling cannot cancel
Murban crude rose from USD 86.01 a barrel on 3 September to USD 95.41 on 10 September. That USD 9.40 increase amounts to 10.9% in a week. SIB’s subsequent report records a partial retreat to USD 94.70 on 17 September, leaving oil approximately 10.1% above its 3 September level.
The sequence matters. A price can fall during the latest week and still leave buyers facing a much higher bill than they did a fortnight earlier. Calling that a return to cheap energy would overlook the starting point.
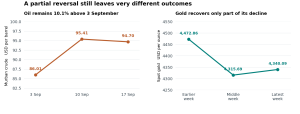
Figure 3. SIB Research commodity observations. Oil dates are explicit. Gold uses the three successive weekly snapshots: USD 4,472.86, USD 4,315.69 and USD 4,340.09 per ounce. Separate axes preserve each commodity’s units; the vertical scales are narrowed to show movement.
Gold fell by USD 157.17 an ounce between the first two observations, a 3.5% decline, before recovering about 0.6% in the latest snapshot. It remained around 3.0% below the first reading. Even assets commonly held for protection against uncertainty can suffer short-term losses. Interest-rate expectations, investor positioning and demand for cash can all influence prices.
SIB links the energy volatility to Middle Eastern supply risks and disruption around the Strait of Hormuz. Its commentary describes temporary relief from alternative shipping arrangements, while freight costs and risk premiums remain elevated. Such workarounds can ease an immediate bottleneck without restoring normal delivery costs.
For Kenya, imported fuel connects the global commodity price to transport, factory operations and distribution costs. An unchanged exchange rate only stabilises the currency conversion. If the dollar price of the product rises, the shilling invoice can still increase.
A business may initially absorb the increase in its margin. If the pressure persists, it may raise prices, reduce deliveries or postpone expansion. That is how a distant shipping disruption can eventually reach a customer buying an ordinary product in a Kenyan shop.
Unchanged pump prices buy time for consumers
EPRA kept pump prices unchanged for the 15 September to 14 October 2026 cycle, as reported by SIB Research. That gives motorists and transport-dependent businesses a period of predictability. It also makes the cost of the next imported cargo especially important.
The underlying import picture was mixed. Between July and August, the landed cost of super petrol fell 7.87% to USD 874.26 per cubic metre. Diesel rose 11.86% to USD 957.05, while kerosene increased 9.71% to USD 1,003.87. The same pump-price outcome therefore covered very different cost movements.
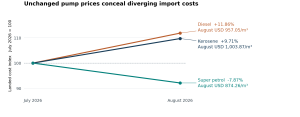
Figure 4. Imported landed costs indexed to July 2026 = 100, using the percentage changes reported by SIB Research. A value of 111.86 means an 11.86% increase. These are import-cost changes, not changes in retail pump prices.
A litre at the pump reflects more than the latest crude-oil quotation. Refined-product costs, shipment timing, exchange rates, taxes and other pricing components affect the final amount. The crude price and the retail price should not be expected to move together immediately or by the same percentage.
The exchange-rate comparison in SIB’s fuel discussion runs from September 2025 to August 2026, at KES 129.52 and KES 129.72 per dollar. It is not a July-to-August comparison and cannot isolate the currency contribution to those monthly import-cost changes.
Europe illustrates how energy pressure spreads
SIB’s international commentary describes European buyers facing more expensive replacement cargoes, freight and insurance. It reports petrol and diesel price increases of 24% and 38% year on year, respectively, and a natural-gas benchmark above EUR 81 per megawatt-hour. These are reported European indicators, not measures of Kenyan fuel inflation.
The wider risk is that high energy costs raise prices while weakening spending and production. Central banks can restrain demand by raising interest rates, but they cannot create an alternative shipping route or replace a lost cargo. Governments seeking to cushion consumers also face the budget cost of subsidies or tax relief.
Kenya’s next pump-price decision will depend on actual import costs, exchange rates and policy choices. Further increases are a risk, not a certainty. Businesses gain more from testing what higher fuel costs would do to their margins than from assuming the current freeze will last indefinitely.
What the market signals mean for everyday decisions
For a saver, the attraction of a Treasury bill begins with knowing when the money will be needed. A short maturity can fit a near-term obligation, but repeated reinvestment exposes the saver to whatever rates are available later. A longer bond offers scheduled coupon payments while exposing an early seller to market-price changes. Matching the investment to the spending date is more useful than comparing coupons alone.
For a business owner, this is a reason to examine cash flow closely. A stable interbank rate cannot compensate for slow customer payments or a sudden increase in delivery costs. A simple sensitivity calculation can help: if fuel represents 20% of total operating costs, a 10% rise in fuel costs would add about 2% to total costs before any change in usage or other expenses. This is an illustration, not a forecast of the next pump adjustment.
For an importer, the relevant currency is the one on the supplier’s invoice. For a company relying on government contracts, the pace of public releases and payment collection deserves as much attention as the auction headlines. Strong demand for government paper does not guarantee prompt settlement of every supplier’s bill.
The next readings to watch are the yields at which the Treasury actually accepts funding, whether domestic maturities are refinanced comfortably, movements in landed fuel costs, and whether development spending accelerates as the fiscal year progresses. Together, they will show whether today’s financial stability is translating into easier conditions for productive activity.
Kenya has room to build on the stability visible in its money market and dollar exchange rate. The harder task is turning that stability into affordable credit, reliable public payments and lower operating costs. Until those gains reach businesses and households, calm markets will remain only part of the economic story.
Read Also: Why Boring Consistency Builds Businesses That Last

About Steve Biko Wafula
Steve Biko is the CEO OF Soko Directory and the founder of Hidalgo Group of Companies. Steve is currently developing his career in law, finance, entrepreneurship and digital consultancy; and has been implementing consultancy assignments for client organizations comprising of trainings besides capacity building in entrepreneurial matters.He can be reached on: +254 20 510 1124 or Email: info@sokodirectory.com

- January 2026 (220)
- February 2026 (248)
- March 2026 (287)
- April 2026 (207)
- May 2026 (192)
- June 2026 (238)
- July 2026 (279)
- August 2026 (223)
- September 2026 (149)
- January 2025 (119)
- February 2025 (191)
- March 2025 (212)
- April 2025 (193)
- May 2025 (161)
- June 2025 (157)
- July 2025 (227)
- August 2025 (211)
- September 2025 (267)
- October 2025 (297)
- November 2025 (230)
- December 2025 (220)
- January 2024 (238)
- February 2024 (227)
- March 2024 (190)
- April 2024 (133)
- May 2024 (157)
- June 2024 (145)
- July 2024 (136)
- August 2024 (154)
- September 2024 (212)
- October 2024 (255)
- November 2024 (196)
- December 2024 (143)
- January 2023 (182)
- February 2023 (203)
- March 2023 (322)
- April 2023 (297)
- May 2023 (267)
- June 2023 (214)
- July 2023 (212)
- August 2023 (257)
- September 2023 (237)
- October 2023 (264)
- November 2023 (286)
- December 2023 (177)
- January 2022 (293)
- February 2022 (329)
- March 2022 (358)
- April 2022 (292)
- May 2022 (271)
- June 2022 (232)
- July 2022 (278)
- August 2022 (253)
- September 2022 (246)
- October 2022 (196)
- November 2022 (232)
- December 2022 (167)
- January 2021 (182)
- February 2021 (227)
- March 2021 (325)
- April 2021 (259)
- May 2021 (285)
- June 2021 (272)
- July 2021 (277)
- August 2021 (232)
- September 2021 (271)
- October 2021 (303)
- November 2021 (364)
- December 2021 (249)
- January 2020 (272)
- February 2020 (310)
- March 2020 (390)
- April 2020 (321)
- May 2020 (335)
- June 2020 (327)
- July 2020 (333)
- August 2020 (276)
- September 2020 (214)
- October 2020 (233)
- November 2020 (242)
- December 2020 (187)
- January 2019 (251)
- February 2019 (215)
- March 2019 (283)
- April 2019 (254)
- May 2019 (269)
- June 2019 (249)
- July 2019 (335)
- August 2019 (292)
- September 2019 (306)
- October 2019 (313)
- November 2019 (362)
- December 2019 (318)
- January 2018 (291)
- February 2018 (213)
- March 2018 (275)
- April 2018 (223)
- May 2018 (235)
- June 2018 (176)
- July 2018 (256)
- August 2018 (247)
- September 2018 (255)
- October 2018 (282)
- November 2018 (282)
- December 2018 (184)
- January 2017 (183)
- February 2017 (194)
- March 2017 (207)
- April 2017 (104)
- May 2017 (169)
- June 2017 (205)
- July 2017 (189)
- August 2017 (195)
- September 2017 (186)
- October 2017 (235)
- November 2017 (253)
- December 2017 (266)
- January 2016 (164)
- February 2016 (165)
- March 2016 (189)
- April 2016 (143)
- May 2016 (245)
- June 2016 (182)
- July 2016 (271)
- August 2016 (247)
- September 2016 (233)
- October 2016 (191)
- November 2016 (243)
- December 2016 (153)
- January 2015 (1)
- February 2015 (4)
- March 2015 (164)
- April 2015 (107)
- May 2015 (116)
- June 2015 (119)
- July 2015 (145)
- August 2015 (157)
- September 2015 (186)
- October 2015 (169)
- November 2015 (173)
- December 2015 (205)
- March 2014 (2)
- March 2013 (10)
- June 2013 (1)
- March 2012 (7)
- April 2012 (15)
- May 2012 (1)
- July 2012 (1)
- August 2012 (4)
- October 2012 (2)
- November 2012 (2)
- December 2012 (1)