
Money Market Funds Should Be Marketed As Saving Products, NOT Investment Options

Money market funds in Kenya have quietly transformed from niche capital market products into the most powerful savings engines in the country, yet they are still largely marketed as “investments” rather than what they really are for most people: flexible, high-yield savings schemes that directly challenge banks for customer deposits. Framing them as savings, not speculation, is the missing narrative that will finally give banks a serious run for their money and unlock a genuine national savings revolution.
For the average Kenyan, the word “investment” carries images of risk, loss, and stories of friends who were wiped out in fake forex, crypto, and real estate schemes. By contrast, “savings” feels safe, familiar, and purposeful: money for school fees, emergencies, rent, and future projects. Kenyan money market funds (MMFs) sit squarely in the middle of these two worlds—technically investments, but operationally and psychologically better suited to be sold as upgraded savings accounts with superior returns, daily compounding, and near-instant liquidity.
The numbers already prove that Kenyans are voting with their wallets. According to CMA’s Q1 2025 data, total assets under management in Collective Investment Schemes hit about KES 496.2 billion, with money market funds accounting for roughly KES 319.7 billion—about 64.4 percent of the entire industry and around 2.0 percent of GDP. This is up from about KES 171.2 billion and 67.4 percent of CIS AUM as at June 2024, showing that MMFs are sucking in cash faster than any other formal savings vehicle in Kenya.

Drilling down into the top 20 MMFs by size makes the story even clearer. CMA data summarised by Nyongesa Sande shows CIC Money Market Fund leading with KES 68.4 billion, followed by Sanlam at KES 50.5 billion, ICEA Lion at KES 17.9 billion, Absa Shilling Fund at KES 13.0 billion, Old Mutual at KES 12.1 billion, Co-op at KES 12.0 billion, and then a long tail of Britam, KCB, Jubilee, Etica, Madison, Nabo, Dry Associates, Lofty Corban, Apollo, GenAfrica, Ziidi, Stanbic, Cytonn, and Kuza. This is not speculative equity money; this is salary money, rent money, cash-flow money.
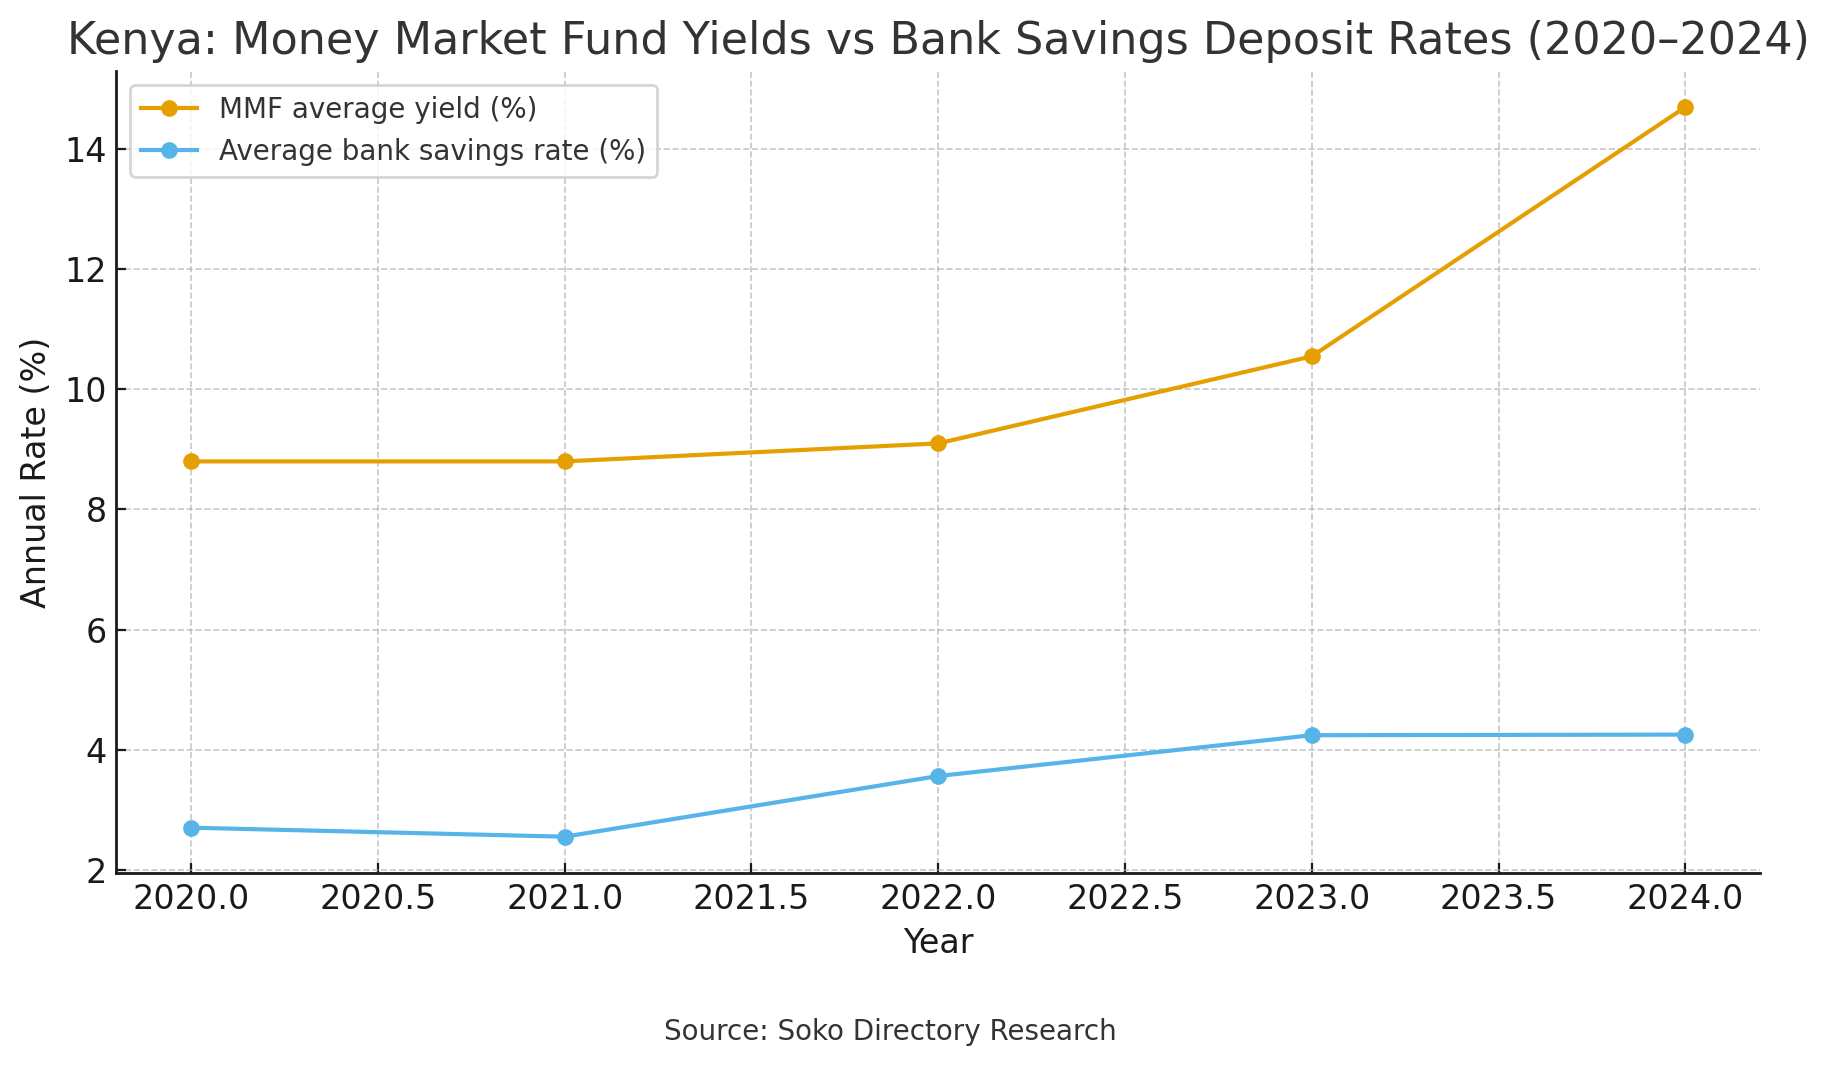
When you look at those top 20 funds as a consolidated balance sheet, you are essentially staring at an alternative savings “megabank”, with hundreds of billions parked in short-term government securities and fixed deposits, earning returns and flowing in and out daily. In fact, Cytonn’s Q1 2025 report shows that while Unit Trust Funds AUM grew 27.5 percent quarter-on-quarter, listed banks’ deposits shrank by 0.2 percent over the same period. That is a quiet deposit migration from banks to MMFs that only makes sense if investors are treating them as better savings accounts, not speculative bets.
Read Also: Liquidity Conditions In The Money Market: A Stable Start To The Year
The yield gap alone makes the case for rebranding them as savings schemes. The same Cytonn report notes that in April 2025, the weighted average deposit rate in commercial banks was about 8.9 percent, while the industry average money market fund yield stood at 12.4 percent and the 91-day T-bill at about 9.0 percent. In other words, MMFs are paying roughly three to four percentage points more than bank deposits for essentially the same underlying risk—short-term government paper and term deposits in the same banks. Calling that an “investment” instead of a “super-saver account” is a marketing own goal.
If you move from averages to specific funds, the story is even more brutal for banks. In Q1 2025, Cytonn estimates the top five MMFs (Gulfcap, Cytonn, Lofty Corban, Etica, Kuza) delivered average effective annual rates of about 15.1 percent, versus an industry average of 12.4 percent. Vasil Africa’s July and September 2025 performance wraps show net annualised returns for leaders such as Gulfcap, Cytonn, Nabo, Lofty Corban, Etica, and Kuza still hovering in the 9.5–11 percent range even after tax. Compare that to many savings accounts at big banks still paying between 0.5 and 4.25 percent, with only a few specialised savers’ products touching 7.5 percent under strict conditions.
Now imagine a five-year linear graph plotting two lines: one representing the average MMF yield and the other the average bank savings/deposit rate from 2020 to 2025. Using CBK and Cytonn data, MMF yields have tended to oscillate around 8–12 percent while deposit rates have stayed in the lower band, mostly 6–9 percent and often below 7 percent in earlier years. The MMF line sits stubbornly above the deposit line almost the entire time, widening especially as investors flee low-yield bank products into CIS. That graph is not merely a picture of “investment performance”; it is a visual indictment of how poorly banks reward Kenyan savers relative to what is safely possible.
Reframing that graph as “Kenya’s real savings rates: banks vs money market funds” would change the national conversation. Instead of telling Kenyans “here is a risky investment that might beat the bank”, the message should be “here is a better savings home for your emergency fund, your chama float, your business cash, and your personal goals, with the same safety profile you already trust in government securities and licensed commercial banks—but with returns aligned to real inflation and opportunity cost.” That single reframing would resonate with the millions of Kenyans who are risk-averse but deeply frustrated with bank charges and low interest.
Importantly, Kenyan regulation already treats MMFs in a way that makes them closer to savings than to high-risk investments. CMA’s Collective Investment Schemes Regulations 2023 cap the weighted average tenor of MMF portfolios at 18